Working with inventory reports in LogMeIn Resolve
The inventory report provides an overview of your organization's hardware asset usage.
To view the inventory report, in the
Console, go to the
Reporting page and select
Get inventory report. Every report is displayed in a separate widget:
- Assets and devices: Displays the number of assets and devices and their purchase cost in your organization.
- CPU: Shows the number of devices in your organization by CPU type. No data shows those devices that have been offline for an extended period of time.
- Assigned assets per user: Displays the number of assets that are assigned to agents.
- Hardware asset report: Lists the number of assets with a warranty that expired in the reporting period or will expire in the next 90 days. It also includes the number of assets with a lifecycle that expired in the reporting period or will expire in the next 90 days.
- Hardware list: Shows devices and their owners. Use the column headers to sort your list.
Change the layout of your reports
You can drag and drop the widgets to reorganize your report. Use the  icon in the top right to move the widget.
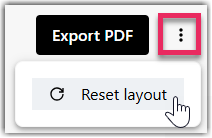
You can return to the default view any time by selecting the hamburger icon and then
Reset layout in the top-right corner.


Switch between graph view and list view
Every executive report, or widget has two views:
- List view helps those "accountant-type" executives, who like reading numbers as line items. This view includes the nitty-gritty details of a report area.
- Graph view provides a nice colored bar or pie chart to dazzle the executives at an even higher level in your organization. This view provides a high-level overview of the report area.
Whichever your preference is, you can switch between these views by selecting the
chart icon at the bottom of a widget. You can change the view of each report separately.


Filter reports by date
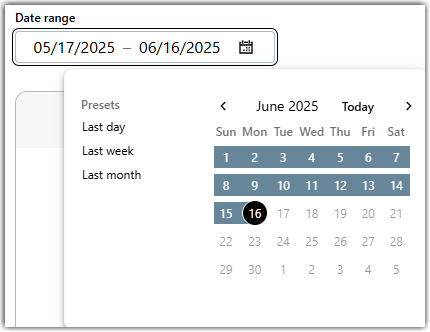
To view a report for a specific date range, select the start and end dates from the calendar at the top of the page.


The report is refreshed automatically.
Download or print a report
You can download any report in multiple formats by selecting the
download icon at the bottom of a widget. By default, a report is downloaded in CSV format and regardless of your selected view, it contains your report as line items.


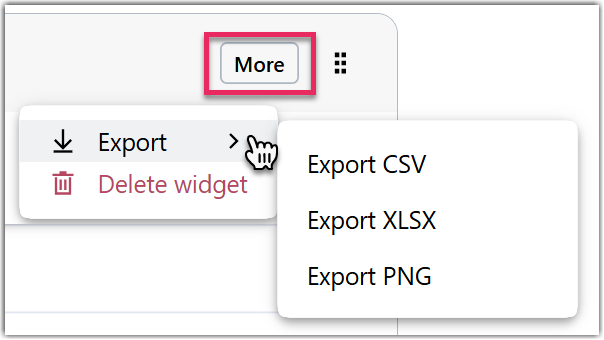
To download a report in a different format, select the down arrow in the bottom right of a widget and then select a report format:
- xlsx: Downloads the report in Microsoft Excel format.
- png: Downloads the report as an image file. This option is only available when your widget is in graph view.
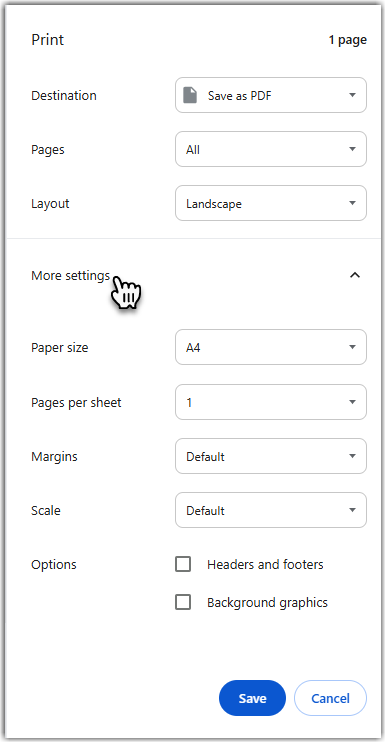
You can also export your whole report as a single page PDF, which includes the current view of your report. Select
Export PDF in the top-right corner and then choose a destination for your report:
- Select Save as PDF to download your report to your device as a PDF file.
- Select a local or network printer to print your report.
Tip: Before you download or print a report, make sure it is displayed properly on a page. Select More settings to make changes to the layout of your report.


Article last updated: 31 March, 2025
