Add a chart to LogMeIn Central reports
Charts give you rich reporting and analysis within the LogMeIn Central workspace. Each chart is a representation of data pulled from a specific LogMeIn Central report or Alert Package.
Who can use this feature? The full set of
LogMeIn Central reports and charts is available for the following:
| Basic/Plus/Premier Subscription | Modular Subscription | User Permissions |
|---|---|---|
|
|
|
What to do next:
Moving and editing charts
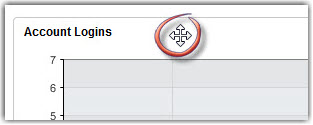
To move a chart, grab it by the header and drag it to the preferred location on the tab. You cannot move a chart to another tab.


To edit a chart, select the wrench icon.


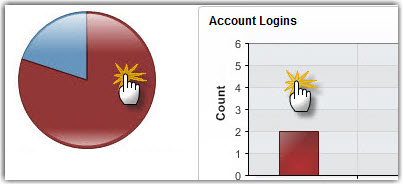
To drill-down from chart view to standard view, select any part of the chart space.


Use default charts in LogMeIn Central reports
The LogMeIn Central Chart Dashboard and Alert Dashboard offer default charts to get you started using the charting feature. Customize and save the default charts, or keep them as they are for easy reference.
Remember: A former LogMeIn Central Premier subscription, or a current LogMeIn Central Base plus Insight module subscription is required to use this feature.
Restoring default charts and alerts
- To restore default charts, go to .
- To restore default alerts, go to .
Default reporting charts
Access Info tab
- Account Logins
- Antivirus Audit
- Remote Access Sessions
- Total Computer Usage by Day
User Info tab
- Total User Activity by Day
- User Summary
- Most Active Users
- Account Audit
Computers tab
- Active Subscription Summary
- Most Active Computers
- Upcoming Subscription Renewals
Management tab
- Low Disk Space (% Free)
- Top 10 Installed Applications
- Top Alerts in Last Week
- Installed Operating Systems
- Unused seats
Default alerts
- Top Alerts (by Computer)
- CPU Alerts
- Disk Space Alerts
- Computer Online/Offline Alerts
